|
MTNA
|
| Home > MTNA > Network Load over Time | English Deutsch |
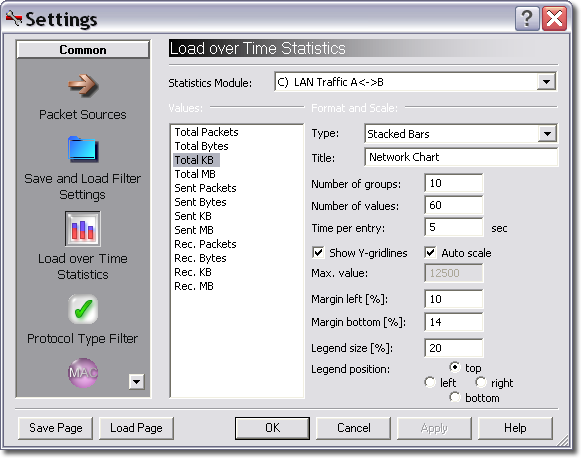
Analyzing Network Load DistributionYou can use the Network Load over Time Stats of the MaaTec Network Analyzer to check the share in network load of different protocols, computer systems (in your LAN or in the internet), connections, or a combination of these (e.g. network connections with protocol). For a quick overview of your network traffic you can also use the real-time statistics. But the Network Load over Time Statistics will display the top causers of network traffic over a configurable period of time. You can choose between different chart types and layouts. All settings are available on the Load over Time page of the Network Analyzer's settings dialog:
The other settings pages of the dialog allow to configure the usual protocol and address filters. These allow to restrict the network data that will be captured for the statistics. This way you can easily analyze only a subset of computer systems or protocols (e.g. display HTTP and FTP traffic but hide SMB/CIFS data). Network Load over Time ParametersThe most important settings of the load over time network statistics are:
Other settings allow to change the look and scaling mode of the chart or to specify the legend position. As you can see, you can use these network statistics for short-term analysis (e.g. 60 entries with 1 second per entry) or long-term traffic stats (e.g. 24 hour summary with 24 entries and 3600 seconds per entry). Exporting the Network ChartsIf you obtained any important results, you may want to save the chart for documentation purposes. The fastest way to copy the chart into another application is to use the clipboard. Just press Ctrl-C on the keyboard or use the Edit menu to copy the currently displayed chart as enhanced metafile to the clipboard. Now you can paste it into any application that supports the EMF format. You may need to resize the chart in the target application as the chart will often be reformatted and some legend entries may overlap after pasting. You can also save the chart to disk (Ctrl-S, File menu, or toolbar). The chart can be saved as PNG, BMP, or EMF file. If you choose a bitmap format, you can configure the bitmap size and resolution in the Save dialog. Higher resolutions will increase the size (in pixels) of the legend and axis text. So be sure to use an adequate bitmap size or the labels may overlap. The recommended export format is PNG 8 bit. This will create very small bitmap files that can be used by most actual applications that can work with images. |
|
| © 2008 MaaTec |
|