Network Chart Types
You can use different chart types to display network Load
over Time
Statistics. Line charts can be used with large numbers of data points ('Number of
values' in the settings dialog) whereas bar charts will become complex if used with
more than 20-100 data points (depending on the bar chart type and screen resolution).
Therefore bar charts are usually more comprehensible. Following chart types can be
chosen in the Load over Time Statistics Settings dialog page:
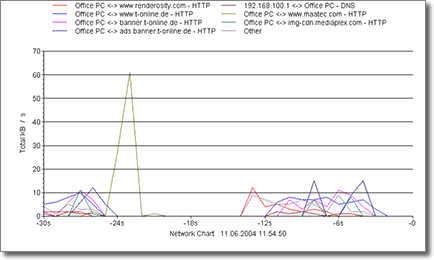
Lines
The network traffic is displayed in a simple line format. You can easily see which
system or protocol caused the most traffic but it is difficult to determine the overall
traffic volume.
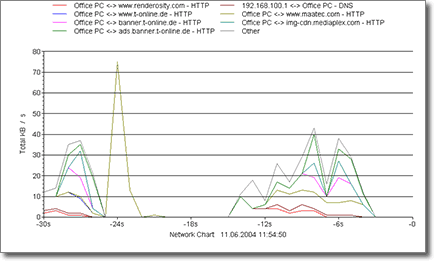
Stacked Lines
The network traffic is displayed as a cumulative set of lines - the data points are
placed one upon the other. It is easy to determine the overall network traffic with
this chart but the amount of traffic per single system or protocol may not be as
identifiable as in the simple line chart.
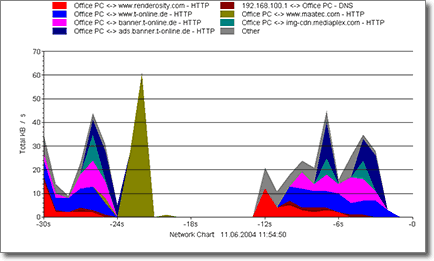
Stacked Lines Filled
This is the same chart as above but the areas between the stacked lines are filled.
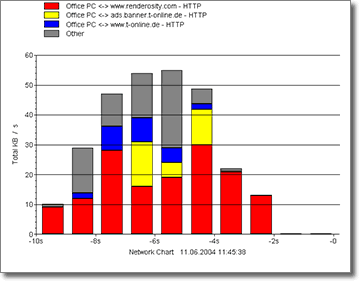
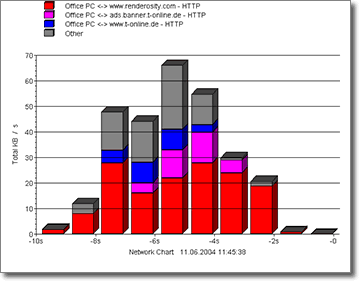
Stacked Bars
The amount of network traffic is represented by bars that are stacked one upon the
other. This way you can easily determine the overall network traffic and the traffic
per system or protocol. But it may be difficult to see the relation between the traffic
caused by different systems. This chart type is usually well suited for up to 100
data entries.
Stacked Bars 3D
Same chart as above but with 3D effect.
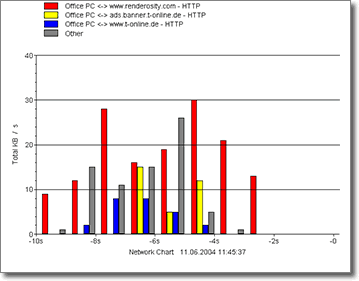
Group Bars
The network traffic per system or protocol is represented by simple bars that are
placed side by side in bar groups. They allow to determine the relation between traffic
volumes of different sources and to find network load peaks of single systems. But
you cannot see the overall network traffic and the chart may become complex even
with few 'Number of values' settings.
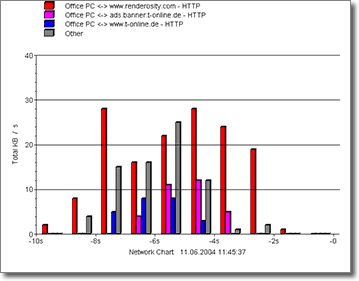
Group Bars 3D
Same chart as above but with 3D effect.
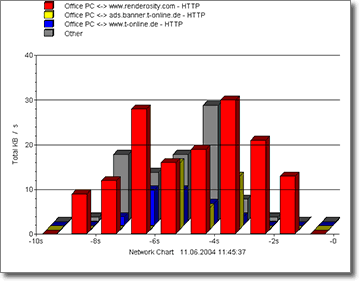
Deep Bars
Almost the same as Group Bars 3D but the bars are placed one after another and not
side by side.
|